Diversity is an integral part of the University of La Verne. It is highlighted both in our University Mission Statement and is one of our four Core Values (Diversity and Inclusivity). Below, we have highlighted key demographic information collected through The Office of Institutional Research. The Office of Institutional Research publishes its Fact Book each spring. The Fact Book has five-year statistics on student enrollment, admissions, performance indicators, faculty and staff, and finance and financial aid.
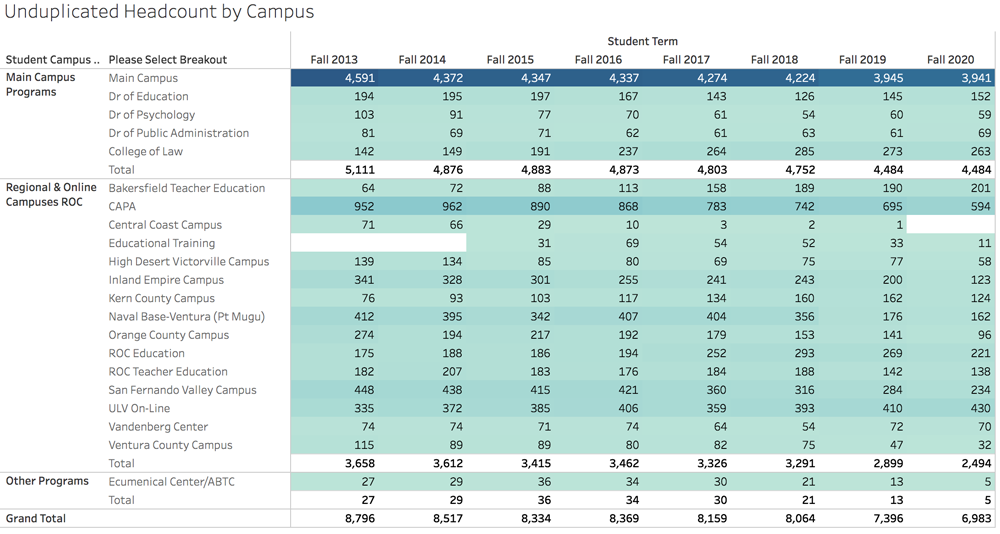
Fall Enrollment Dashboard
Access the dashboard, with breakdown by campus and student trait, here. |
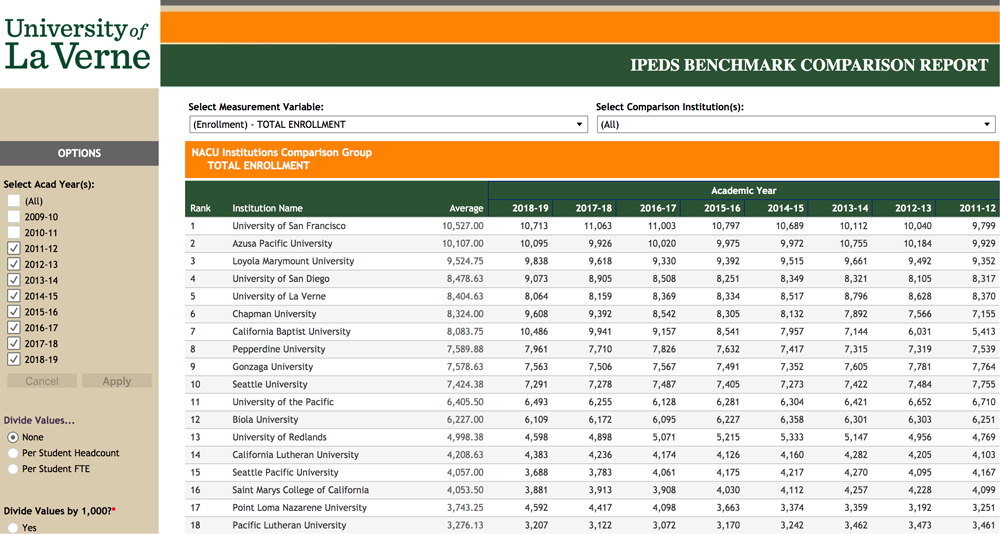
IPEDS Comparison Dashboard by NACU
Access NACU’s dashboard here. |